Density-of-state, Fermi-Distribution, and differential conductivity
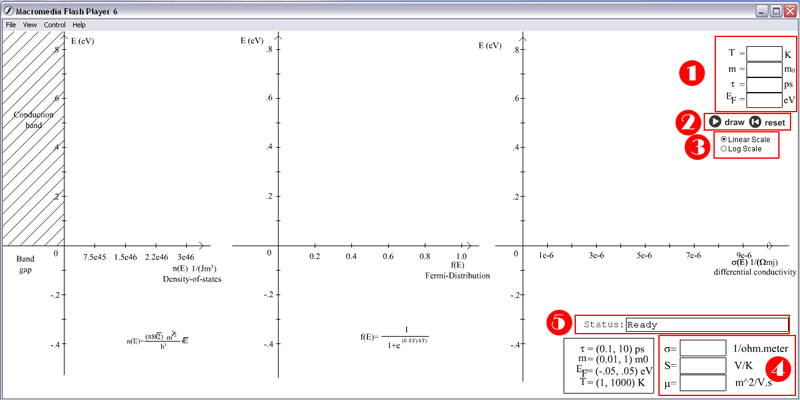
This applets is a combination of 3 different graphs: density-of-states, Fermi-distribution, and differential conductivity.

![]() Input area. You
can plug in temperature (T), mass (m), mean-free-time(t), and Fermi energy
(EF) level.
Input area. You
can plug in temperature (T), mass (m), mean-free-time(t), and Fermi energy
(EF) level.
![]() Draw, Reset
button. After input all data, click Draw to generate the graph. Hit reset
to erase all graph and reset scale selection.
Draw, Reset
button. After input all data, click Draw to generate the graph. Hit reset
to erase all graph and reset scale selection.
![]() Linear / Log
scale option box. Density of state and differential conductivity graph
can be display in both linear and log scale. Once selected, the option
remain untill reset. Default scale in linear.
Linear / Log
scale option box. Density of state and differential conductivity graph
can be display in both linear and log scale. Once selected, the option
remain untill reset. Default scale in linear.
![]() Output box.
The applets also calculate the electrical conductivity, sebeck cofficient
and mu based on the environment provided.
Output box.
The applets also calculate the electrical conductivity, sebeck cofficient
and mu based on the environment provided.
![]() Status box.
Status box.

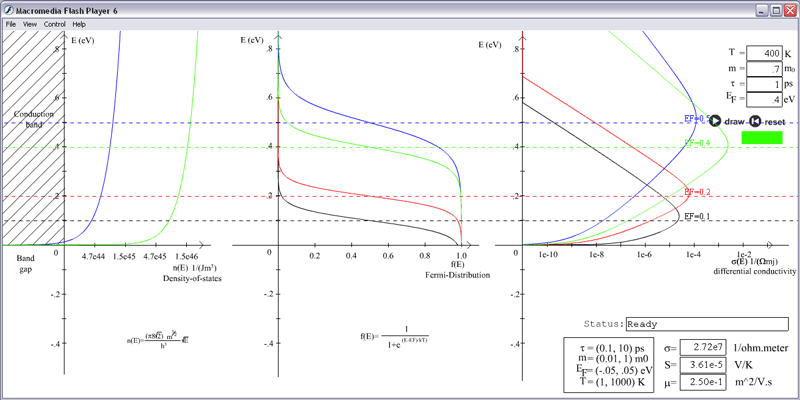
The applet in action