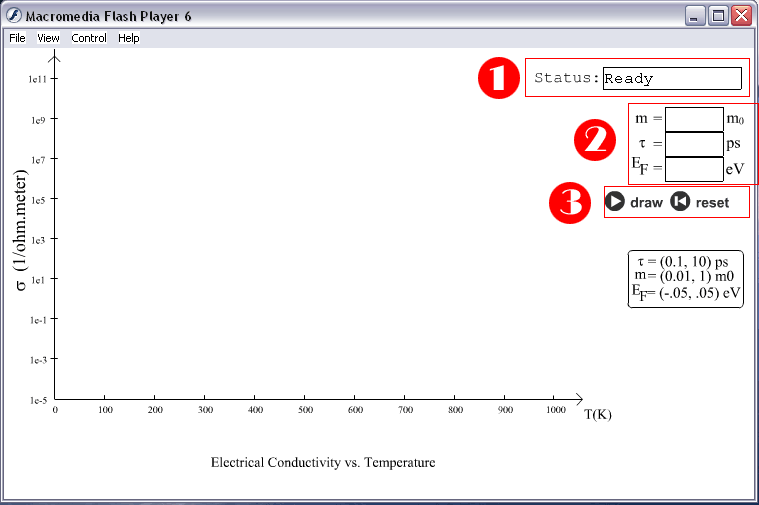
![]() Status box.
Status box.
![]() Input area.
You can plug in mass (m), mean-free-time(t), and Fermi energy (EF) level.
Input area.
You can plug in mass (m), mean-free-time(t), and Fermi energy (EF) level.
![]() Draw, Reset
button. After input all data, click Draw to generate the graph. Click
Reset to erase all graphs.
Draw, Reset
button. After input all data, click Draw to generate the graph. Click
Reset to erase all graphs.
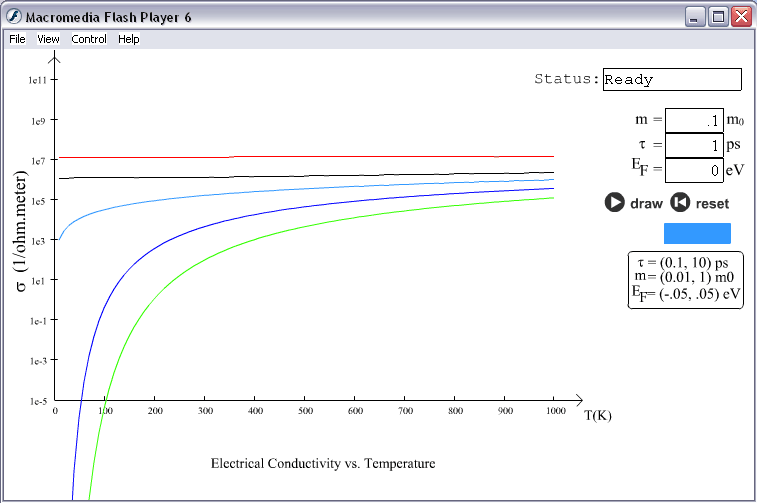
 The applet
in action